


Framework
Framework
Lesson 21 : T-Spot
Lesson 21 : T-Spot
Lesson 21 : T-Spot
Beginner
Beginner
4 min
4 min
T-Spot
T-Spot
T-Spot
The T-spot is the area where the higher timeframe wick is expected to form. The purpose of the T-spot is to identify a fair value gap, high, low, or, if none are present, an opposing candle, which price can react from to form the higher timeframe wick.
The T-spot is the area where the higher timeframe wick is expected to form. The purpose of the T-spot is to identify a fair value gap, high, low, or, if none are present, an opposing candle, which price can react from to form the higher timeframe wick.
The T-spot is the area where the higher timeframe wick is expected to form. The purpose of the T-spot is to identify a fair value gap, high, low, or, if none are present, an opposing candle, which price can react from to form the higher timeframe wick.
In a bullish scenario, observe price as it opens, forms a low while respecting the T-spot, and then expands higher before forming a high and closing.
In a bullish scenario, observe price as it opens, forms a low while respecting the T-spot, and then expands higher before forming a high and closing.
In a bullish scenario, observe price as it opens, forms a low while respecting the T-spot, and then expands higher before forming a high and closing.
In a bearish scenario, observe price as it opens, forms a high while respecting the T-spot, and then expands lower before forming a low and closing.
In a bearish scenario, observe price as it opens, forms a high while respecting the T-spot, and then expands lower before forming a low and closing.
In a bearish scenario, observe price as it opens, forms a high while respecting the T-spot, and then expands lower before forming a low and closing.
0.5 CISD
0.5 CISD
0.5 CISD
The first component of the T-spot is marking 0.5 of the CISD, as explained in the opposing candles section. Use a rectangle tool to highlight the area between the opening price and the 0.5 level of the CISD, measured from body to body.
The first component of the T-spot is marking 0.5 of the CISD, as explained in the opposing candles section. Use a rectangle tool to highlight the area between the opening price and the 0.5 level of the CISD, measured from body to body.
The first component of the T-spot is marking 0.5 of the CISD, as explained in the opposing candles section. Use a rectangle tool to highlight the area between the opening price and the 0.5 level of the CISD, measured from body to body.
Equilibrium
Equilibrium
Equilibrium
The second component of the T-spot is marking the equilibrium of the higher timeframe candle, as explained in the equilibrium section. Use a rectangle tool to highlight the area from the equilibrium.
The second component of the T-spot is marking the equilibrium of the higher timeframe candle, as explained in the equilibrium section. Use a rectangle tool to highlight the area from the equilibrium.
The second component of the T-spot is marking the equilibrium of the higher timeframe candle, as explained in the equilibrium section. Use a rectangle tool to highlight the area from the equilibrium.
Annotating the T-Spot
Annotating the T-Spot
Annotating the T-Spot
There are three rules to follow when marking the T-spot:
There are three rules to follow when marking the T-spot:
There are three rules to follow when marking the T-spot:
Always include the equilibrium
Only include the CISD marking if it overlaps with the equilibrium
Adjust the equilibrium rectangle to the opening price of the new candle
Always include the equilibrium
Only include the CISD marking if it overlaps with the equilibrium
Adjust the equilibrium rectangle to the opening price of the new candle
Always include the equilibrium
Only include the CISD marking if it overlaps with the equilibrium
Adjust the equilibrium rectangle to the opening price of the new candle
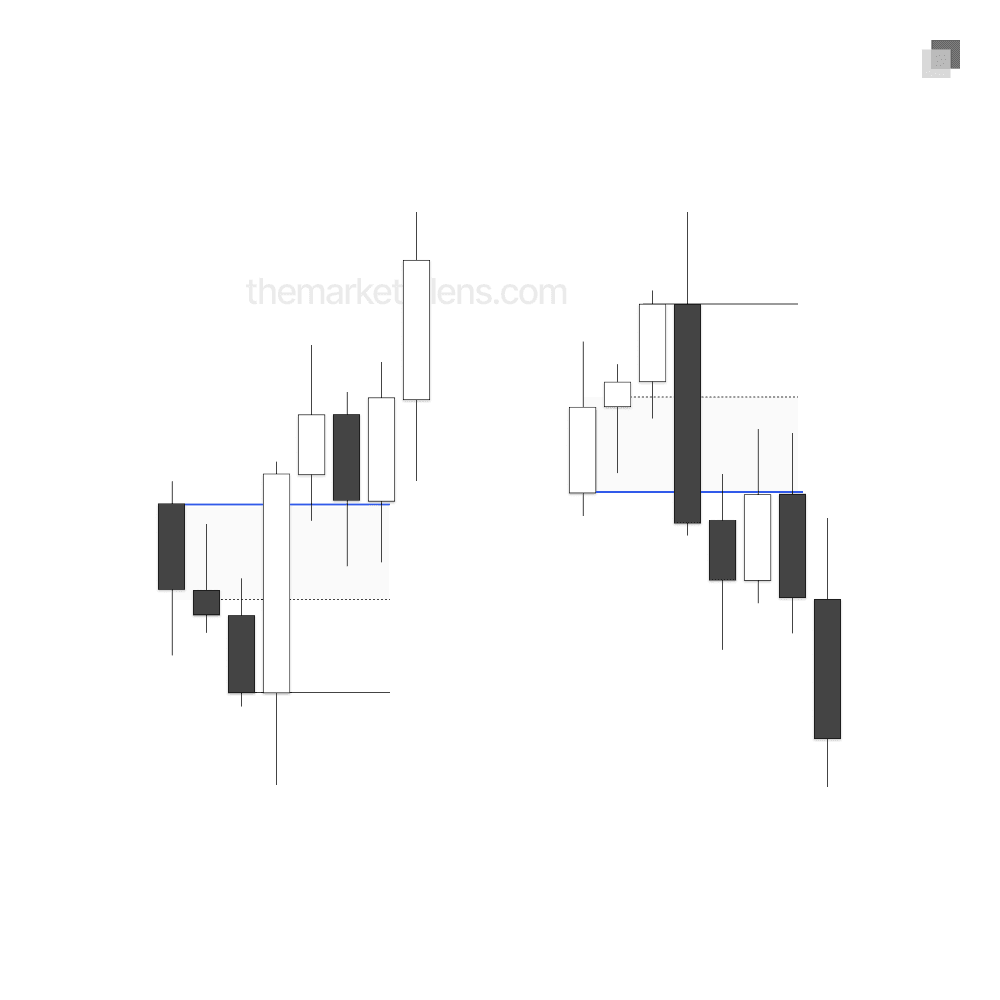
In the example below, both the equilibrium and the CISD have been marked. Since there is no overlap between the two, following the established rules, only the equilibrium is used for the T-spot.
In the example below, both the equilibrium and the CISD have been marked. Since there is no overlap between the two, following the established rules, only the equilibrium is used for the T-spot.
In the example below, both the equilibrium and the CISD have been marked. Since there is no overlap between the two, following the established rules, only the equilibrium is used for the T-spot.
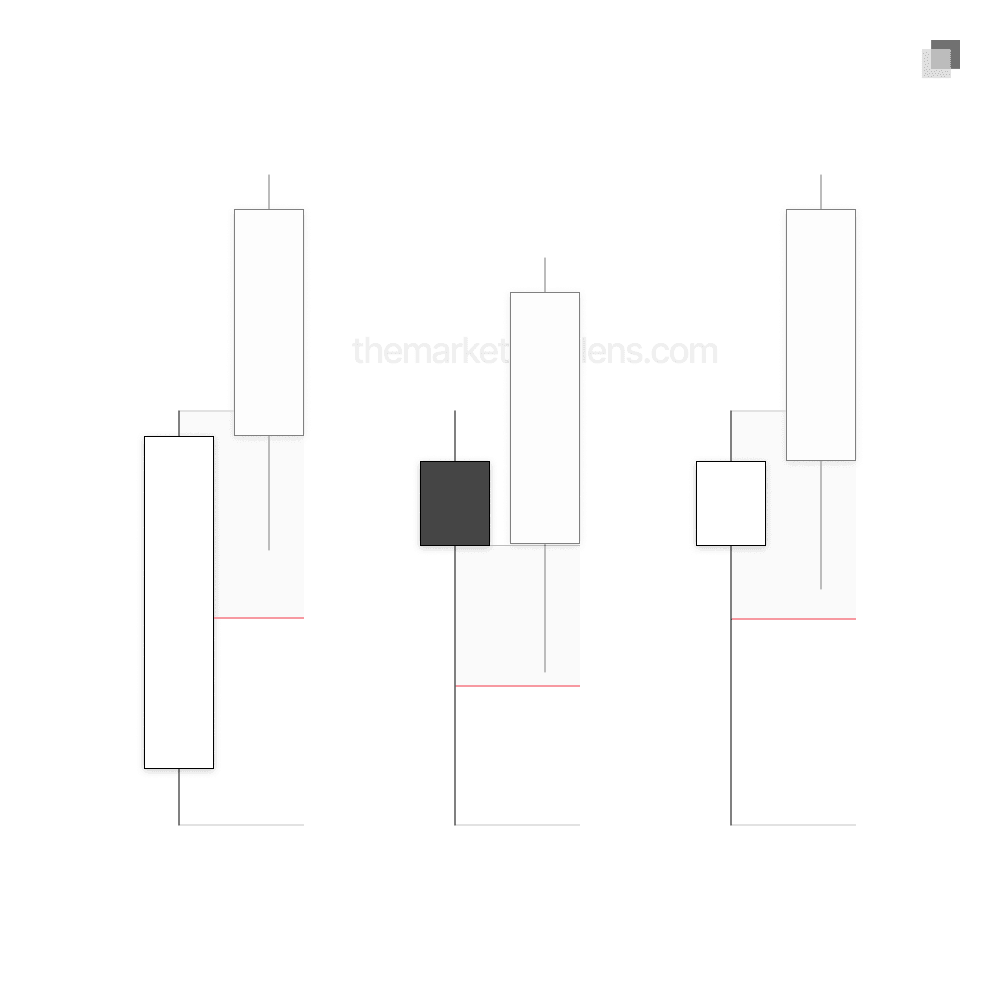
With only the equilibrium marked, the final rule requires adjusting the equilibrium rectangle to align with the opening price of the new candle. This adjustment is necessary because the wick is expected to form within this area, and it is not possible for price to create its upper high below the candle’s opening price.
With only the equilibrium marked, the final rule requires adjusting the equilibrium rectangle to align with the opening price of the new candle. This adjustment is necessary because the wick is expected to form within this area, and it is not possible for price to create its upper high below the candle’s opening price.
With only the equilibrium marked, the final rule requires adjusting the equilibrium rectangle to align with the opening price of the new candle. This adjustment is necessary because the wick is expected to form within this area, and it is not possible for price to create its upper high below the candle’s opening price.

With the T-spot fully marked, this is the area where we expect the wick in candle 3 to form. It is important to note that while it is ideal for price to remain below this level, the critical requirement is that price does not close above it. If price closes above the T-spot, the setup is no longer valid for anticipating expansion.
With the T-spot fully marked, this is the area where we expect the wick in candle 3 to form. It is important to note that while it is ideal for price to remain below this level, the critical requirement is that price does not close above it. If price closes above the T-spot, the setup is no longer valid for anticipating expansion.
With the T-spot fully marked, this is the area where we expect the wick in candle 3 to form. It is important to note that while it is ideal for price to remain below this level, the critical requirement is that price does not close above it. If price closes above the T-spot, the setup is no longer valid for anticipating expansion.


Here is an example of a candle 3 closure with the T-spot marked. Following the three rules, the equilibrium is included and adjusted to the opening price of candle 4, the CISD rectangle is marked, and the section that overlaps with the equilibrium is retained on the chart.
Here is an example of a candle 3 closure with the T-spot marked. Following the three rules, the equilibrium is included and adjusted to the opening price of candle 4, the CISD rectangle is marked, and the section that overlaps with the equilibrium is retained on the chart.
Here is an example of a candle 3 closure with the T-spot marked. Following the three rules, the equilibrium is included and adjusted to the opening price of candle 4, the CISD rectangle is marked, and the section that overlaps with the equilibrium is retained on the chart.


The standard for trading education and guidance
2026 The Market Lens - All Rights Reserved
The standard for trading education and guidance
2026 The Market Lens - All Rights Reserved
The standard for trading education and guidance